Live Wi-Fi Water Meter Reader
So this is a project that I started way back in 2012. For a while I had thought I'd be able to make a Kickstarter out of it; however, I've finally realized I just don't have the time or know-how.
The Problem
It started out when the water bill seemed higher than it should be, and I wanted to know why. Unfortunately, even with their "smart" meter, the water company's reporting was at best, daily. This didn't really help me figure out what was using all of the water.

The Dilemna
My first thought was to possibly capture the transmissions used for automatic meter reading with an SDR (software-defined radio). Unfortunately, after looking into it a bit, it looked like by default the meter only reported every hour. In addition, it looked like there was some non-trivial encoding being done on the signal, which would have made it a lot more work than I was hoping for.
Next up, I knew some power meters have an IR LED to report usage; however, I couldn't find one anywhere on the meter. This left me with adding another meter in-line after the water company's, but most of the ones I could find were upwards of $200. Since I was hoping to keep my budget under $50, this was a non-starter.
The Idea
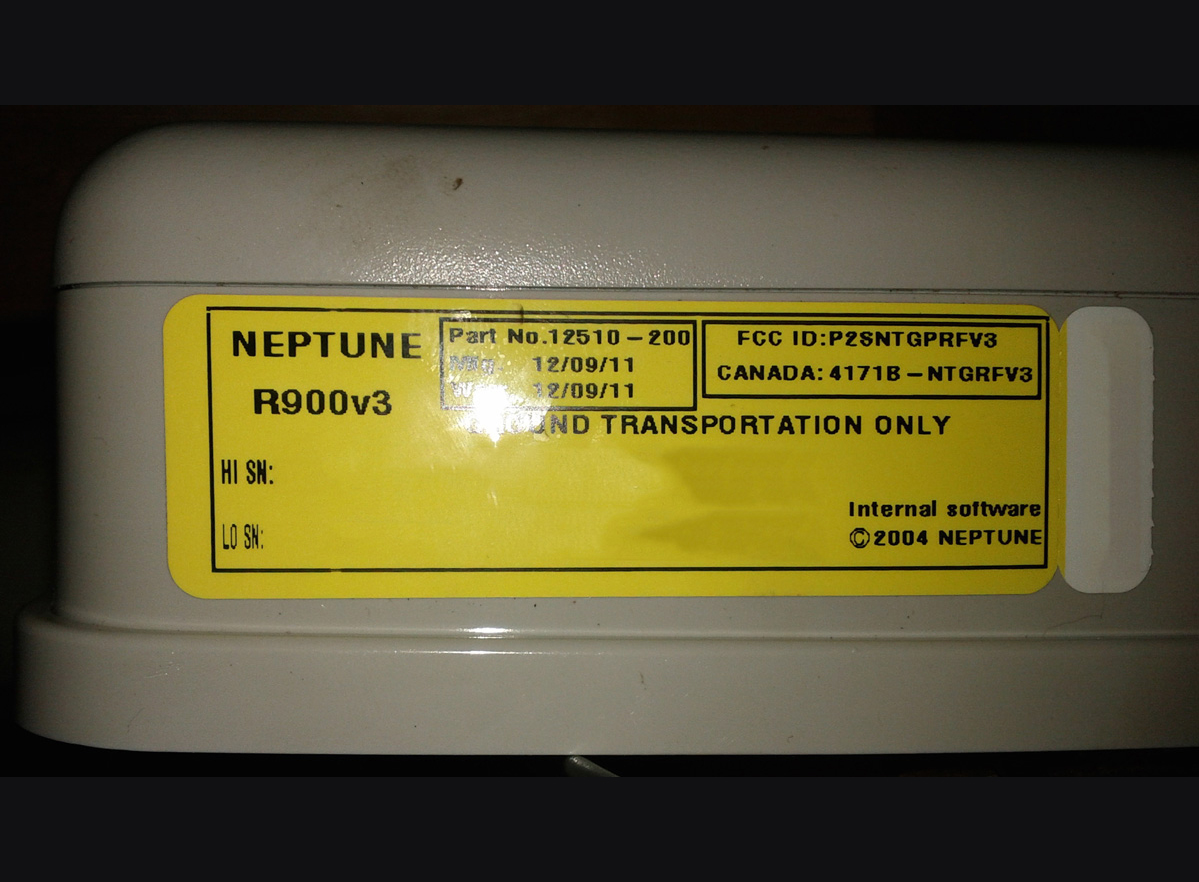
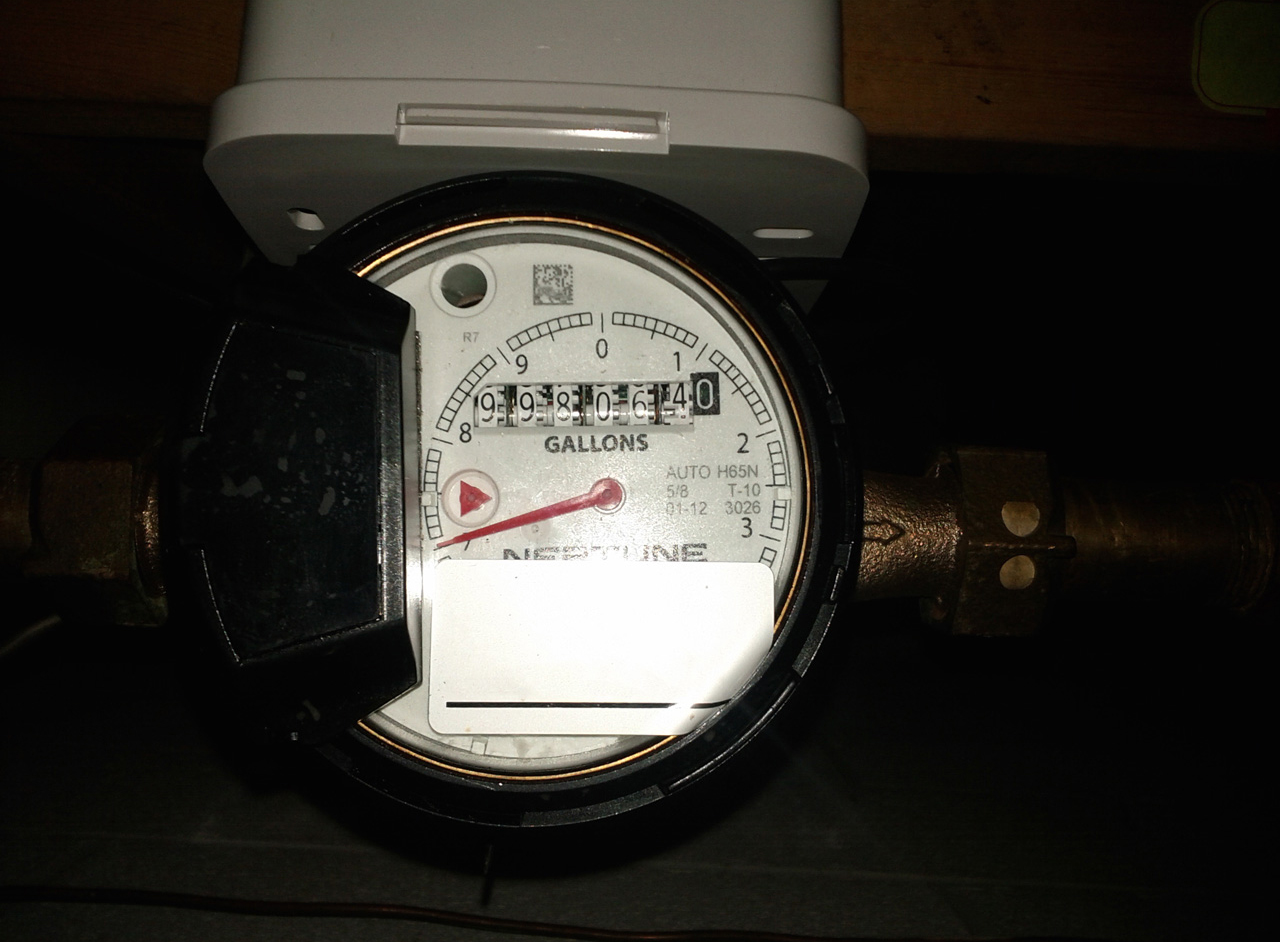
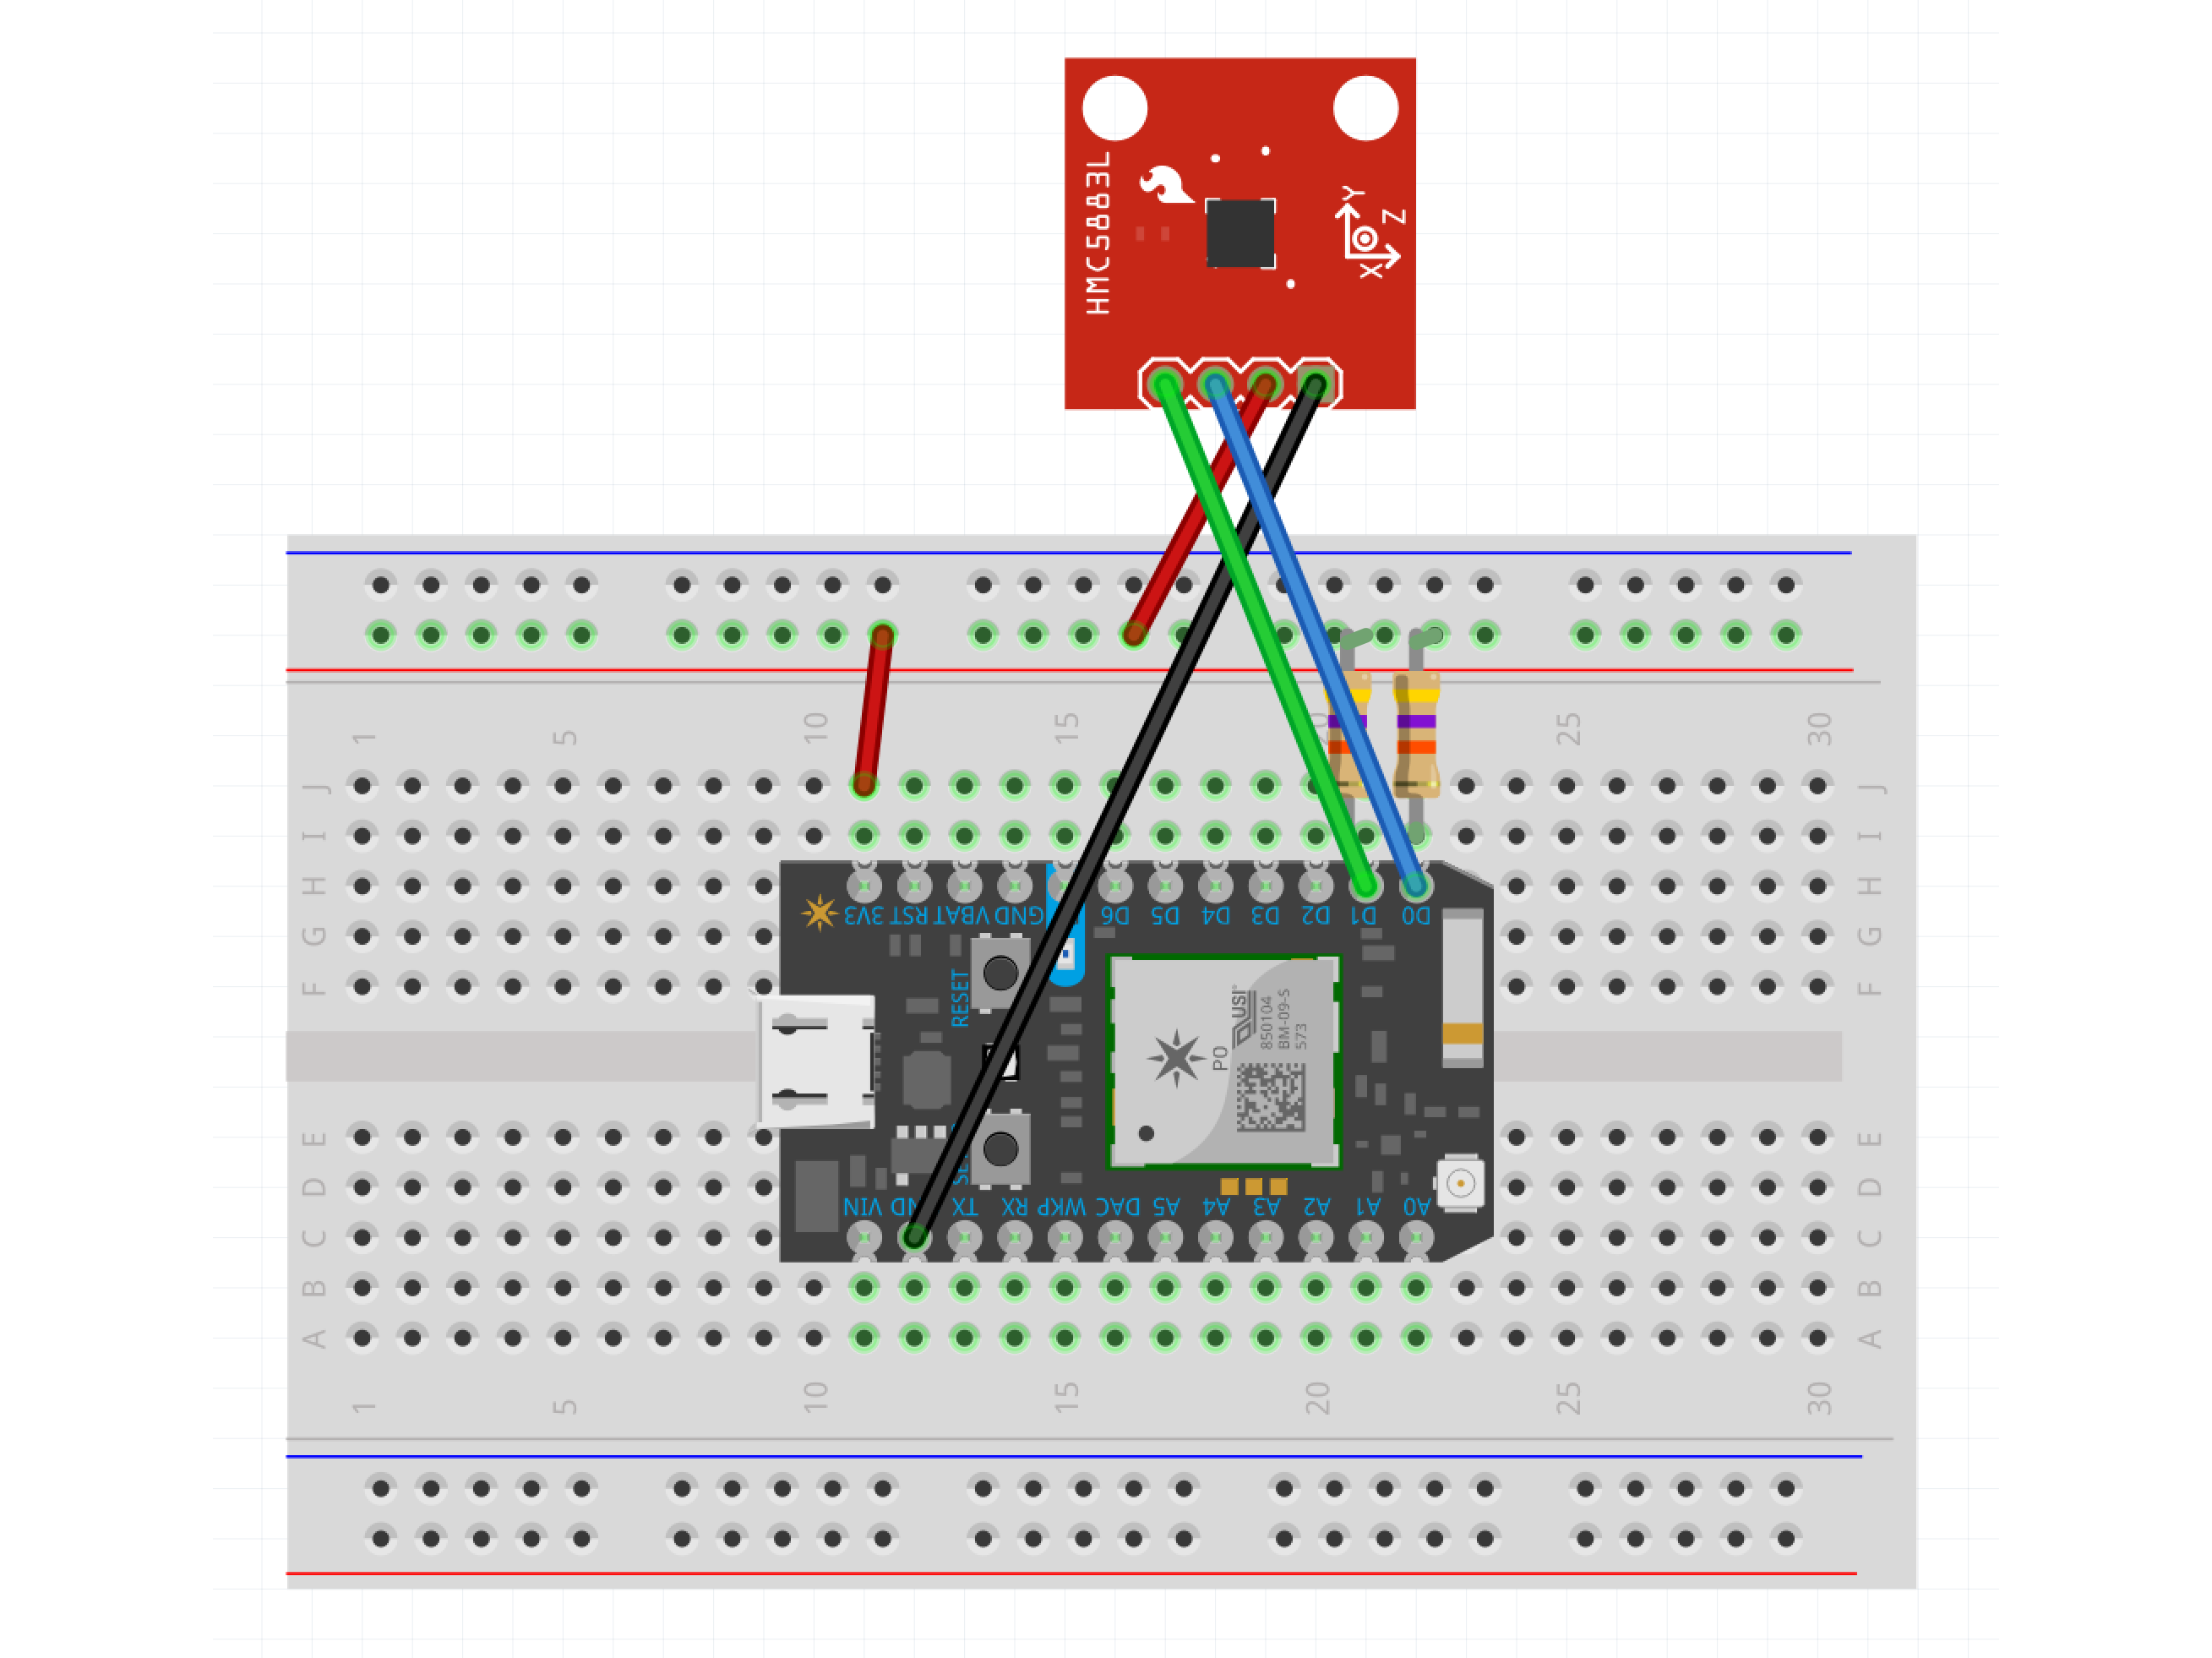
Rather stymied at this point, I began researching how water meters actually, well…meter. Looking through the PDF linked in the image above, I discovered my meter is of the magnetic nutating disc type. More or less, a disc wobbles as water is used which in turn spins a permanent magnet. This oscillating magnetic field is picked up with a Hall effect sensor.
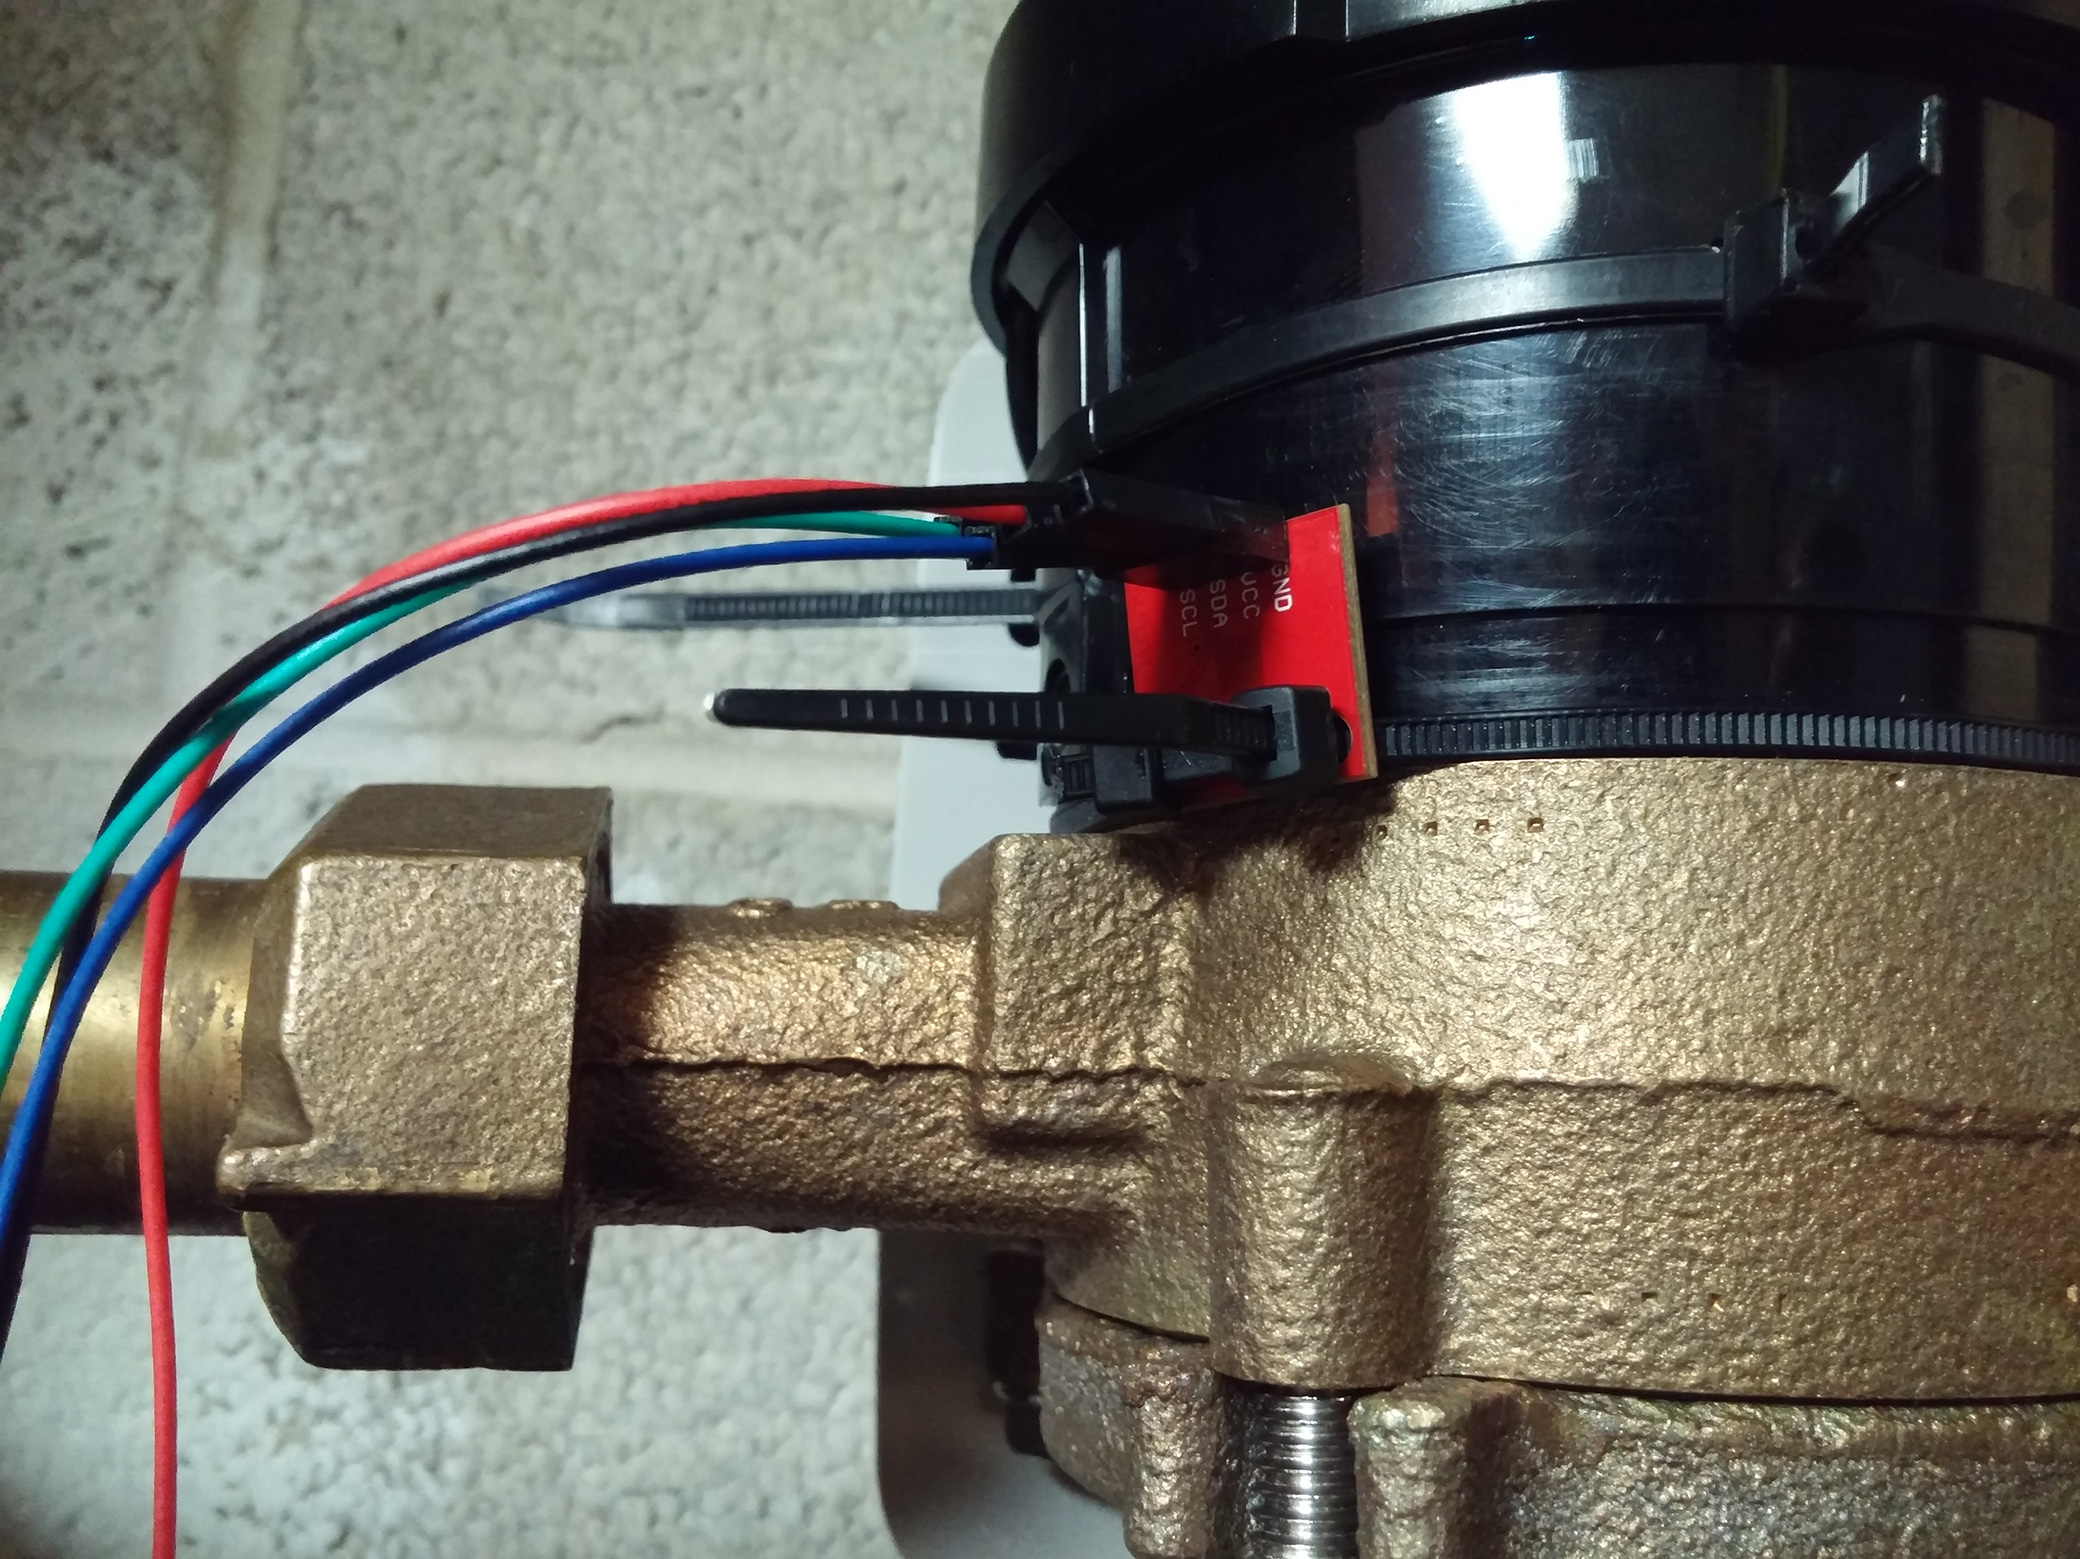
Now we're getting somewhere. It just so happened I had some spare parts from building a quadcopter with my friend including…a magnetometer. Enter the magical HMC5883L. With my handy Arduino, I wrote a quick sketch to stream the magnetometer's readings and stuck it onto the water meter. SUCCESS!
The Solution
At this point, all I had was a stream of field strengths in LSb (with Gain=1, 1090 LSb = 1 Gauss), but it did oscillate with water usage so I knew I had it. The faster the oscillation, the more water being used. After collecting the data for a day, the numbers seemed to bottom out at -928 LSb (-853.76 mG) and top out at -328 LSb (-301.76 mG). To make things easier, I mapped that to -300 LSb and 300 LSb. Lastly, I grabbed a 1L bucket and counted how many oscillations it took to fill it. This gave me an oscillation/liter ratio, which I could use to convert all future data into liters or gallons.
Skip forward a year and my Spark Core arrived. Time to add Wi-Fi! Sadly, the first few months of the Spark Core were a little…rough, especially when trying to combine it with MQTT. Short on time, I had to shelve the project. :[
Let's do the time warp again. The year is 2015 and the successor to the Spark Core, the Particle Photon is sitting on my front porch, waiting to change the world of water metering forever! Okay, I might be overdoing it a little, but I was excited.
The Design
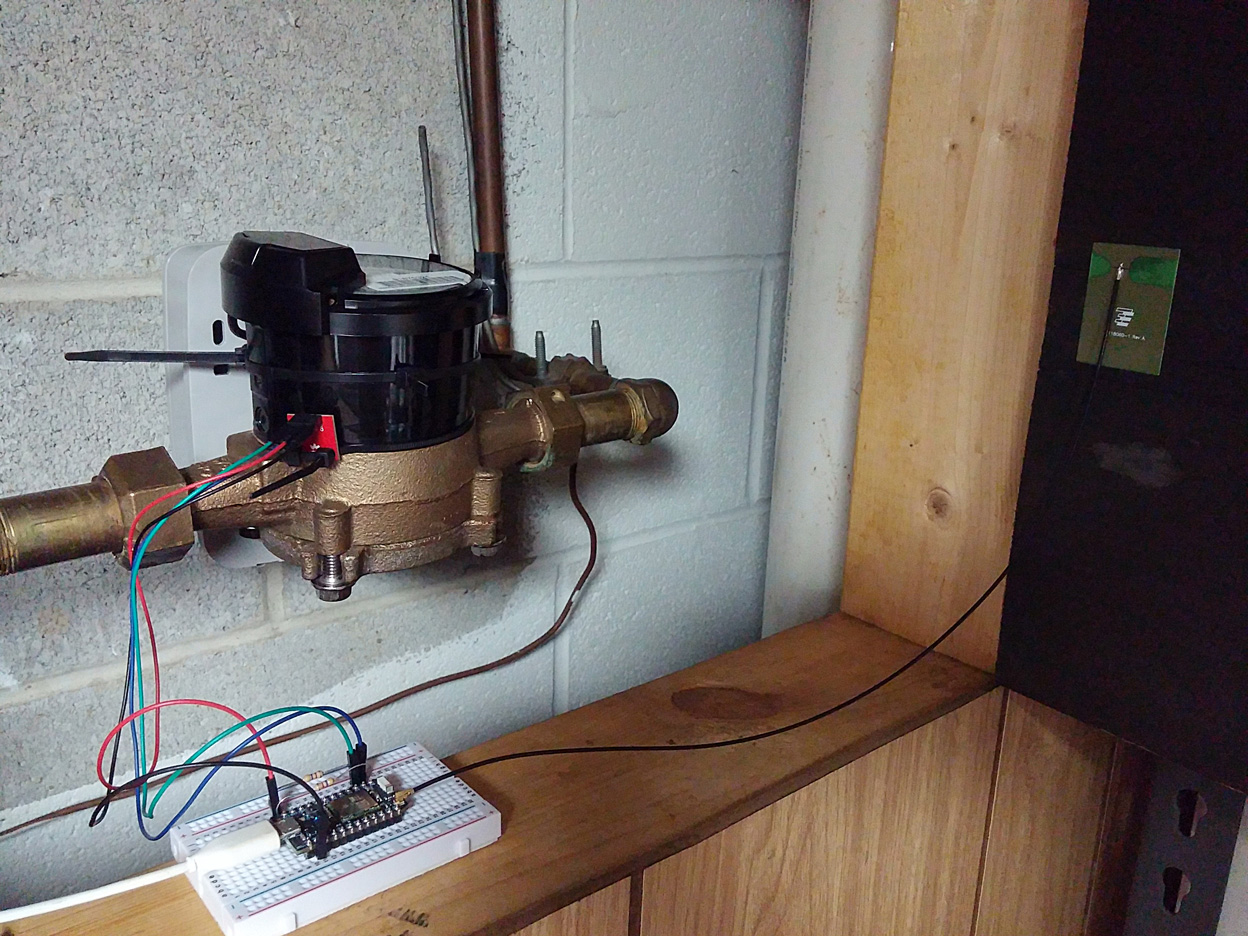
The Spark Core and the Photon are supposed to be interchangable so I dug out the old circuit, swapped the two chips, and uploaded the old code. The good people at Particle didn't lie. Things worked and I had a way to monitor the data, but I needed a way to collect and store it. I'd been looking into time series databases over the summer, and I was eager to try one of them out. Meet InfluxDB.
I figured I'd do something along the lines of having the Photon read the data, send it to some collection node with MQTT, and then store it in InfluxDB. The Spark Core and Photon still seem to struggle with MQTT, though, so I instead opted to skip that step entirely. InfluxDB has an HTTP API, and the Photon can make HTTP requests, so I just had to combine the two, and the rest is history. It also conveniently interfaces extremely well with Grafana.
The Code
#define db_host "0.0.0.0"
#define db_port 0000
#define db_user ""
#define db_pass ""

#define hmc5883l_address 0x1E
#define publish_delay 10000


STARTUP(WiFi.selectAntenna(ANT_EXTERNAL));


unsigned long last_publish = 0;
unsigned long now = 0;
unsigned int crossings = 0;

int new_val = 0;
int old_val = 0;

boolean changed = false;

TCPClient client;
int16_t y;


void setup() {
    Wire.begin();

    Wire.beginTransmission(hmc5883l_address);
    Wire.write(0x00); // Select Configuration Register A
    Wire.write(0x38); // 2 Averaged Samples at 75Hz
    Wire.endTransmission();

    Wire.beginTransmission(hmc5883l_address);
    Wire.write(0x01); // Select Configuration Register B
    Wire.write(0x20); // Set Default Gain
    Wire.endTransmission();

    Wire.beginTransmission(hmc5883l_address);
    Wire.write(0x02); // Select Mode Register
    Wire.write(0x00); // Continuous Measurement Mode
    Wire.endTransmission();
}

void loop() {
    now = millis();

    Wire.beginTransmission(hmc5883l_address);
    Wire.write(0x03); // Select register 3, X MSB Register
    Wire.endTransmission();

    Wire.requestFrom(hmc5883l_address, 6); delay(4);
    if(Wire.available() >= 6) {
        // Ignore X and Z Registers
        Wire.read(); Wire.read(); Wire.read(); Wire.read();
        y  = Wire.read() << 8; // Y MSB
        y |= Wire.read();      // Y LSB
    }

    old_val = new_val;
    new_val = map(y, -928, -328, -300, 300);
    changed = (old_val < 0 && new_val > 0) || (old_val > 0 && new_val < 0);

    if(changed) {
        crossings += 1;
    }

    if(crossings > 0 && (now - last_publish) >= publish_delay) {
        if(client.connected() || client.connect(db_host, db_port)) {
            String influx_data =
                String::format("water value=%u", crossings);
            String http_content_len =
                String::format("Content-Length: %u", strlen(influx_data));
            String http_host =
                String::format("Host: %s:%u", db_host, db_port);
            String http_request =
                String::format("POST /write?db=meters&u=%s&p=%s HTTP/1.1",
                                db_user, db_pass);

            client.println(http_request);
            client.println(http_host);
            client.println(http_content_len);
            client.println();
            client.println(influx_data);
            client.println();
            client.flush();
            client.stop();

            crossings = 0;
            last_publish = now;
        }
    }

    delay(10);
}
The Graph
The Answer
After all that, I did end up finding out what was using all of the water. It turns out, one of the underground drip lines in my garden had cracked over the winter and sprung a leak. It was using just slightly more water than it was supposed to, but when run for hours every week, it added up to be quite a lot.
The Future
Currently, I'm just enjoying being able to pull up the Grafana dashboard and see when I flush the toilet or take a shower. Sure, I kind of already know when I do those things, but now I can see their impact. Exactly how much water was used, how much it cost me, etc. Since InfluxDB has its own querying language, I'm also able to generate statistics like weekly usage, highest day or hour of usage, or compare how much water various settings on the washing machine use. It's pretty empowering and pretty cool.
I read a paper a few years back of some researchers using neural networks and an electric meter to identify the device using power from its "usage signature". Maybe instead of logging in and looking at the graphs, it could push a notification to my phone that someone has been taking a rather excessive shower or in my case, the drip system is using too much water.
After seeing this, my brother asked me if I could do the same for his natural gas meter so that'll probably be the next project. I think it'd be neat to have this sort of monitor for all of our utilities. Who knows what sort of information could be teased out of the data then?